Voluntary Application and 2024 Winner of the Award for Statistical Excellence: Human Fertilisation and Embryology Authority Dashboard

2024 Winner of the Award for Statistical Excellence in Trustworthiness, Quality and Value for the Human Fertilisation and Embryology Authority Dashboard

The Human Fertilisation and Embryology Authority (HFEA) launched what is thought to be the first fertility dashboard of its kind in the world. The dashboard offers access to accurate and customisable UK-wide data dating back 30 years from the HFEA’s national fertility register in an accessible format on the HFEA website. The dashboard displays information on fertility treatments such as egg freezing and birth rates, patients, partners, donors and children born as a result of these treatments. This includes around 1.5 million IVF and 270,000 donor insemination treatments undertaken by around 665,000 patients since 1991.

Judges of the award praised this entry for the value delivered by HFEA’s work, as well as the response to user needs.

Applying the Code: Trustworthiness, Quality and Value (TQV)

The publication of the HFEA dashboard has produced Value by improving the ease of accessing our 30 years of national UK fertility register data. The dashboard enabled them to increase the breadth of data available on their website, in comparison to tables and graphs available in statistics publications, while presenting the information in a customisable and user-friendly format.

The aim of this dashboard was to make the data the HFEA holds more easily accessible and to reduce administrative work required to respond to data enquiries. The idea was based on efficiency and the benefits of improving data transparency. The dashboard was completed internally by a very small team within a year supported by a wide range of specialists within the HFEA and user testing, including initial training of the dashboard software, coming in underbudget. Following launch, around a third of data requests have been satisfied by referrals to the dashboard, with over 30,000 public views in the first two months, leading to improved team efficiency.

In demonstrating Trustworthiness, the HFEA provided caveats to data provided in the dashboard, particularly with success rates where preliminary figures are impacted by missing outcomes of treatments from clinics. The HFEA included a grey band in the figures to denote where data is preliminary and included caveats in tooltips to mark where data should be interpreted with caution, further information is available on the landing page and in the Quality and methodology report (Q&M). Planned updates and a change log are detailed on the landing page, as well as details on how patients cannot be identified from the data.

Quality of the data used from the HFEA register is ensured through validation exercises with clinics, inspections and audits. Production of data in the dashboard was quality assured by qualified staff through a multistep process documenting checks on each aspect of the data and presentation, including accessibility, scripts and verifying that data matches previously published sources. Details on limitations in the data and coherence with other publications are detailed in a Q&M report, and key limitations are additionally detailed in information icons in the dashboard.

Peter Thompson, Chief Executive of the HFEA, said:

“We’re delighted that the HFEA dashboard has won this year’s Trustworthiness, Quality & Value award. Our dashboard, which we believe to be the first of its kind in the world, is designed to provide impartial information in an easy-to-use format to help inform the many difficult decisions around fertility treatment. This award is a real tribute to the quality of work of our expert team at the HFEA and a recognition of the huge interest in UK fertility data. The HFEA will continue to build on the work recognised by this award and enable the public, clinicians and researchers to access the data we collect. Thank you to the Office for Statistics Regulation and the Royal Statistical Society for the award.”

Citations from users:

Prof Adam Balen, consultant in reproductive medicine at Leeds teaching hospitals NHS trust said:

“The new dashboard enables researchers to access data for study and patients to access information to better inform them on their fertility journey and thereby demystify some of the complexities behind the statistics of treatment outcomes.”

Other useful background

User testing was performed with patients, researchers, clinicians, staff and stakeholder organisations to ensure the dashboard could satisfy the various needs of key audiences. Improvements were made based on feedback including additions of information notes, FAQs on the landing page, and production of a two-minute animated explainer video.

The finalised dashboard also includes a link to a feedback form to ensure HFEA continue to receive input from users. Accessibility was reviewed by an external company, informing updates including improvements to keyboard-only navigation and developing dynamic alt-text.

The dashboard has been covered in numerous media publications with a focus on the dashboard’s user-friendly design and improved data transparency. Recent feedback from a patient referred to using the dashboard as a trusted source to check following meetings with clinics to see whether the rates they quoted were consistent with values displayed on HFEA’s dashboard.

Related Links

Voluntary Application: UK Health Security Agency Data Dashboard

2024 Highly Commended: Award for Statistical Excellence in Trustworthiness, Quality and Value for the UKHSA’s data dashboard.

Judges praised this entry for the value delivered by UKHSA’s work, as well as the response to user needs.

Applying the Code: Trustworthiness, Quality and Value (TQV)

UKHSA first became a voluntary adopter of the Code during the pandemic when they created their COVID-19 dash-board, winning the award in 2022 for demonstrating how they uphold the pillars of Trustworthiness, Quality and Value (TQV) in their published Statement of Compliance.

UKHSA’s continued application of TQV is exceptional, with this new joint initiative (undertaken in partnership with the Data Product Development division within Data, Analytics and Surveillance Group and the DevOps division within the Technology Group, the revised UKHSA data dashboard went live in September 2023, completely replacing the previous COVID-19 dashboard.

TQV was central to the design of this new UKHSA data dashboard, with the pillars allowing the Agency to:

  • save time by moving to leading technology;
  • free up resource by introducing more automation and Reproducible Analytical Pipelines; and
  • save money by decommissioning the COVID-19 dashboard.

Ensuring a smooth transition between old and new, the team ran both dashboards in parallel and kept users updated through regular communications and positive press relations.

Impact with Numbers

Building on the strong foundations of its predecessor, the new dashboard has enhanced accessibility, data quality, metrics, and user experience for the public and professionals.

Extensive user research was key in the development stages – with 5,000 responses from stakeholder sessions, focus groups and surveys. Since launch, insights reveal that:

  • 69,000 users have visited the dashboard;
  • 4,000,000 Application Programming Interface (API) requests have been logged – from websites integrating data from the dashboard into their sites;
  • 34GB of data has been downloaded; and
  • a cost saving of £5m has been achieved.

Preparing for Future Health Threats

Supporting UKHSA strategic priorities to improve action on health security through data and insight, new data and features on health threats are continually being developed.

Recent additions have included:

This summer, data on anti-microbial resistance, climate change, and public health incidents will be added, as well as enhancements to the API to increase flexibility and make it easier to select multiple features within the data.

Accessibility and Diversity

Designed to meet the needs of as many people as possible, dashboard users can:

  • change colours, contrast levels and fonts;
  • zoom in up to 300% without the text spilling off the screen;
  • navigate most of the website using just a keyboard; and
  • navigate most of the website using speech recognition and screen reader software.

It is also the first UKHSA product to pass the Government Digital Service’s alpha and beta assessments – ensuring operational excellence for the Agency in their data ambitions to be as accessible as possible.

Sam Organ, Director of Data Operations, said:

‘We are delighted to have been recognised by the Royal Statistical Society and the Office for Statistics Regulation for our work to deliver a trusted, high quality and valuable data service to our users.

‘The UKHSA data dashboard puts accessibility and automation at the heart of its design. This approach has been instrumental in helping people use data to drive health security decisions as well as supporting UKHSA to make cost savings.

‘This is an excellent tribute to what UKHSA can achieve through cross-Agency collaboration and I would like to thank colleagues from across DAS, Technology, Health Protection Operations, Clinical and Public Health and Science, for their continued work to build and deliver such a successful service. Well done to all involved!’

More information

You can find out more information on the team’s Pulse page, and visit the UKHSA data dashboard on gov.uk. If you have a question, you can contact: datadashboard@ukhsa.gov.uk

Voluntary Application: Fable Data

2023 Winner of the Award for Statistical Excellence in Trustworthiness, Quality and Value for the ‘Data for Good programme’.

Applying the Code: Trustworthiness, Quality and Value

Fable Data became a voluntary adopter of the Code in February 2023, demonstrating how they uphold the pillars of Trustworthiness, Quality and Value (TQV) in their published Statement of Compliance.

Their application of TQV is unique given how they balance their commercial interests with a solid commitment to public good. Fable Data regards Trustworthiness as non-negotiable, seeing rigorous compliance procedures as vital to ensuring they are led by data ethics and governance.

Quality is ensured by Fable’s data and tech team to obtain the full potential of the raw data ingested, enriching the data, and making it usable.

Value for greater society is at the heart of Fable’s Data for Good programme. Their pro-bono arm supplies data to policymakers and academics at no cost to contribute to the public good. While Fable demonstrated particular excellence in this pillar, they could not deliver this initiative without also fulfilling Trustworthiness and Quality.

In doing so, their planned commitment to TQV is strong, with an evolving application of the pillars as their entrepreneurial ideas change and grow.

Luke Kennedy, CEO at Fable Data said:

“We are delighted to win this award. I recall my time working in policy and feeling the severe lack of datasets as timely and comprehensive as Fable’s. As a result, it means a lot to me that we’re recognised for the work we do to add value for the public good. There’s a fulfilling circularity to that.”

Who are Fable Data?

Fable Data sources anonymous consumer and SME spending data from banks across Europe for use in commercial, academic and policy research.

Their mission is to arm the world’s decision-makers with the most reliable, trustworthy and timely consumer transaction data available. With compliance and data ethics at the core of their business, they’re trusted by many of the world’s most influential organisations including The International Monetary Fund, the Deutsche Bundesbank, the University of Oxford and many more.

What is the ‘Data for Good programme’?

Fable Data was founded with a vision to provide a pro bono granular dataset for government bodies, academics, and national statistical offices, to be available for innovative research and policy making for the creation of new economic indicators. Through this pioneering innovation for public good, Fable’s ‘Data for Good programme’ encouraged new opportunities for combining and extrapolating economic insights for key institutions. These included HM Treasury, BEIS, and the Deutsche Bundesbank, who could see the value in Fable’s datasets and used them in combination with official statistics and other sources to provide a deeper insight into economic activity.

Through supporting these organisations across a wide range of policy areas, Fable Data could answer economic questions with their granular insights at real time speed. Their European consumer transaction data really helped the understanding of the underlying drivers for changes in spending trends. During the pandemic and beyond, in partnership with the University of Nottingham, this has helped explore aspects of regional recovery, demonstrating the impact of local lockdowns, economic tracking with geographical granularity and challenged the framing of conventional regional economic policy. The ‘Data for Good programme’ continues to contribute to further innovation, including literature on key macroeconomics topics as seen via IMF working papers on inflation weights and the impact of monetary policy on consumption.

In support of the work undertaken by Fable Data, a spokesperson from BEIS said:

“We have used Fable Data to help support questions in a wide range of policy areas. The speed of delivery allows us to get insight into rapidly evolving policy questions in real time, while the granularity of the transaction data enables us to understand the underlying drivers of changes in spending trend. Combined, these features make Fable transaction data a powerful complement to other datasets such as official statistics.”

Fable Data’s International Initiatives

Fable Data recently acted as the sole private data provider at the 2023 European Big Data Hackathon organised by Eurostat. This event saw teams representing various European national statistical offices take part in a challenge to create a policy alert trigger using card transaction data.

This was for some teams their first taste of working with big data, and the experience subsequently has encouraged them to explore adopting big data capabilities.

Here live-streamed is the winning teams’ presentation of their innovative outputs at the European Commission’s Conference on New Techniques and Technologies for Statistics.

Voluntary Application: UK Health Security Agency (UKHSA)

Winner of the Award for Statistical Excellence in Trustworthiness, Quality and Value 2022 for the COVID-19 dashboard.

“The COVID-19 dashboard team are truly delighted to receive this endorsement from the RSS and the OSR for our work. We put honesty and transparency at the heart of this project, to provide COVID-19 data to anyone who needs it. We know that our users value this data and it is needed to enable people to go about their daily lives. We are therefore proud to demonstrate how we uphold the trustworthiness, quality and value principles so that the dashboard can be used with confidence. We are very grateful for all the user feedback and to our team for their dedication to producing such high-quality dashboard during difficult circumstances.”

Clare Griffiths, Head of the COVID-19 Dashboard at the UK Health Security Agency

Who are the UK Health and Security Agency?

The UK Health Security Agency (UKHSA) is responsible for protecting every member of every community from the impact of infectious diseases, chemical, biological, radiological and nuclear incidents and other health threats. UKHSA provide intellectual, scientific and operational leadership at national and local level, as well as on the global stage, to make the nation’s health secure.

What is the COVID-19 dashboard?

The UKHSA created the COVID-19 Dashboard as one of the main tools to establish rates of COVID and vaccination across the UK, that quickly became one of the main and trusted sources of data on the pandemic. It has been used extensively by decision makers and wider, experiencing over 1 million users per day during peak times.  These users include government ministers and other decision makers who rely on this information to help shape the UK’s COVID response, as well as the public making decisions about their daily lives.

These statistics remain high-profile, are complicated to produce, receive daily scrutiny and much wider discussion, so must fully demonstrate trustworthiness, quality and value.  The UKHSA team continue to modify the dashboard, to undertake user engagement and make improvements. The dashboard data continues to remain incredibly important to people as we move to the living with COVID phase of the government’s strategy.

Applying the Code

Providing COVID dashboard users with trustworthiness, Quality and Value (TQV) was essential from that start of pulling this data together. UKHSA are proud of the commitment made to the Code and have prominently published a statement of compliance on their website so it’s visible and easy to find.

Trustworthiness, Quality and Value

The dashboard statistics are developed by a team of analysts and data scientists at UKHSA, in collaboration with devolved administrations, NHS England, NHS Test and Trace and the DHSC, under the guidance of the Head of Profession for Statistics. Data are compiled from reputable sources, including government and NHS departments in England, Northern Ireland, Scotland and Wales.

This presents challenges, for instance, making sure that users can easily compare data and understand differences in how nations produce data. The dashboard team maintain close contact with these organisations, to ensure our work is aligned. Data must be current, so the dashboard is updated every weekday: a big task for a small team.

Engaging with users has been key to the dashboards success and getting the data correct, with over 40,000 people involved in the last survey. UKHSA know the public like the open data and the API data download options the dashboard provides, with over 1 million downloads each week by individuals for their own data purposes.

Collecting user feedback through the survey will continue, along with interviews, use of analytics and email contact, with nearly 30,000 interactions and communications so far. This has enabled UKHSA to maintain very high levels of trust in the data, continually make improvements and add new features.

Voluntary Application: Demonstrating the value of the COVID-19 Dashboard through the Code of Practice for Statistics

Background

The Coronavirus (COVID-19) in the UK Dashboard is the official UK government website for data on COVID-19. The pandemic is constantly changing, so to help people make quick decisions we are producing the data at pace. The dashboard isn’t formally badged as official statistics (due to, for example, the need for a speedy turnover and ministerial involvement in decision making), but it does meet many of the official statistics criteria, so we decided to voluntarily apply the Code of Practice for Statistics.

This signals that our statistics meet the 3 ‘pillars’ of the Code:

  1. they have public value
  2. they are high quality
  3. they are trustworthy

In this case study we focus on the value pillar, which states that statistics and data should:

  • be useful
  • be easy to access
  • remain relevant
  • support understanding of important issues

The five principles of the ‘Value’ pillar are:

  1. Relevance to users
  2. Accessibility
  3. Clarity and insight
  4. Innovation and improvement
  5. Efficiency and proportionality

Benefits of applying the code

Applying the code voluntarily shows our commitment to transparency and our desire to increase user trust in the dashboard. Our published statement of compliance helps users to understand the processes involved. Its application not only benefits users, but also helps us as producers to demonstrate what we are doing well and identify areas for improvement.

Available and well used by all

The dashboard is extremely well-used, with:

  • 1 million unique users per day, on average
  • up to 70 million daily hits

Peak time for use is 4pm when the dashboard is updated. There can be around:

  • 30,000 concurrent hits per minute right before 4pm
  • 250,000 to 300,000 per minute as soon as the data are released

We make as much data available on the dashboard as possible, without compromising quality or confidentiality. Our API and data download options allow people to use the data for their own purposes. Again this is highly popular, with downloads averaging around 1.3 million per day.

We want the dashboard to be accessible to as many users as possible. It is simple to use, helping anyone to navigate the data and visualise trends over time and across geographic regions. We commissioned an accessibility audit in July 2020 and provide a full accessibility statement on the dashboard. For example, users can:

  • read simple summaries of the data
  • access data in a variety of formats. The dashboard has many visual elements, but all data is also provided in text form.

We continually seek to improve functionality and make sure we comply with the Web Content Accessibility Guidelines version 2.1 AA standard. We list non-compliances for transparency, and, where possible, explain how we will fix these or why we don’t comply.

Innovative and continually improving

We want to provide the most reliable statistics and ensure the best user experience possible. We always seek user feedback to help us develop and improve the dashboard. We collect this via:

  • individual research sessions, with over 100 conducted to date
  • emails to our feedback mailbox, which is monitored daily and receives many hundreds of email each week
  • a programme of regular user surveys. The latest had over 38,000 responses. Our next survey will be in early 2022
  • analytics, for example, to find out which parts of the site are most popular

Feedback helps us to improve data presentation to make sure it is easy to understand and meets the needs of different users. In response to user feedback, in 2022 we plan to research and improve how people experience the site on mobile devices.

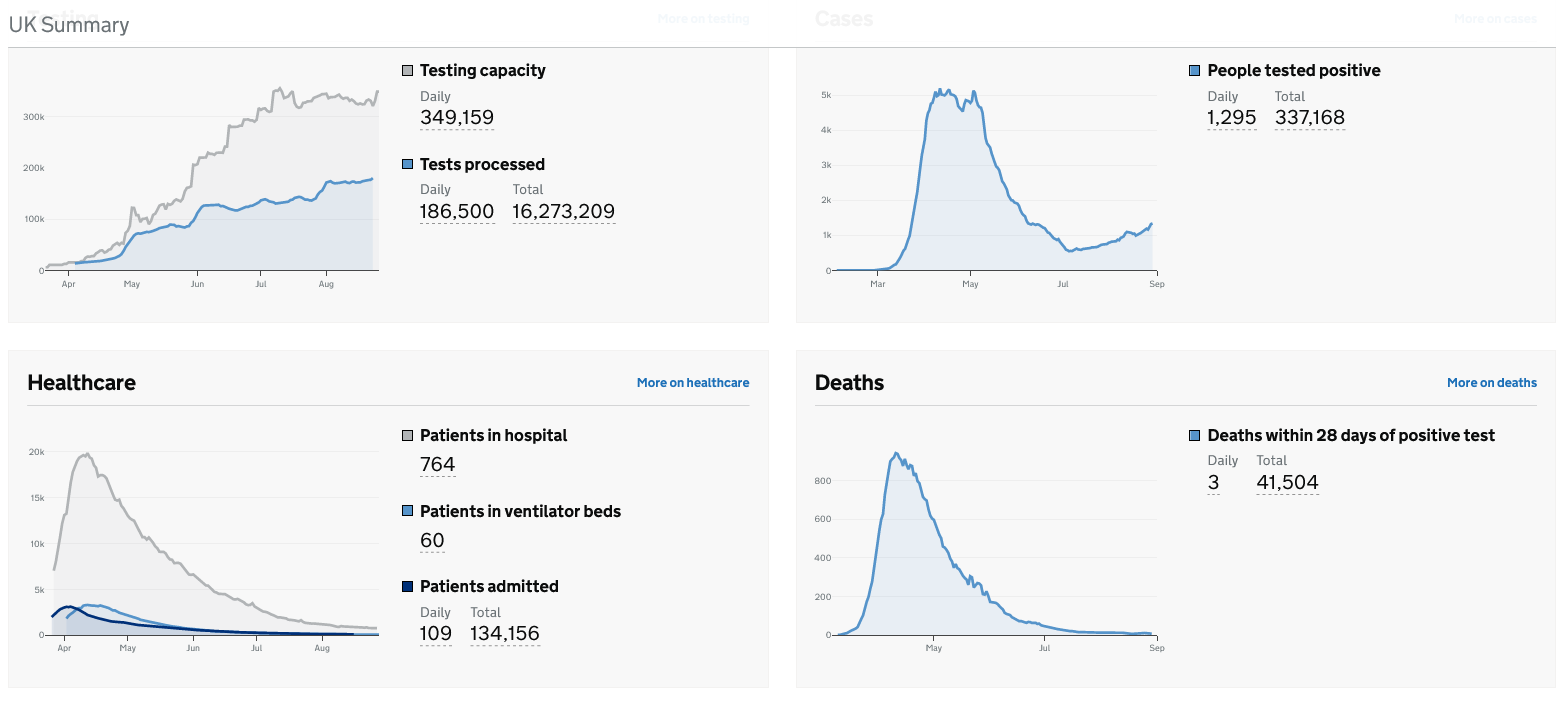
Changing the dashboard to meet the needs of the pandemic – home page comparison

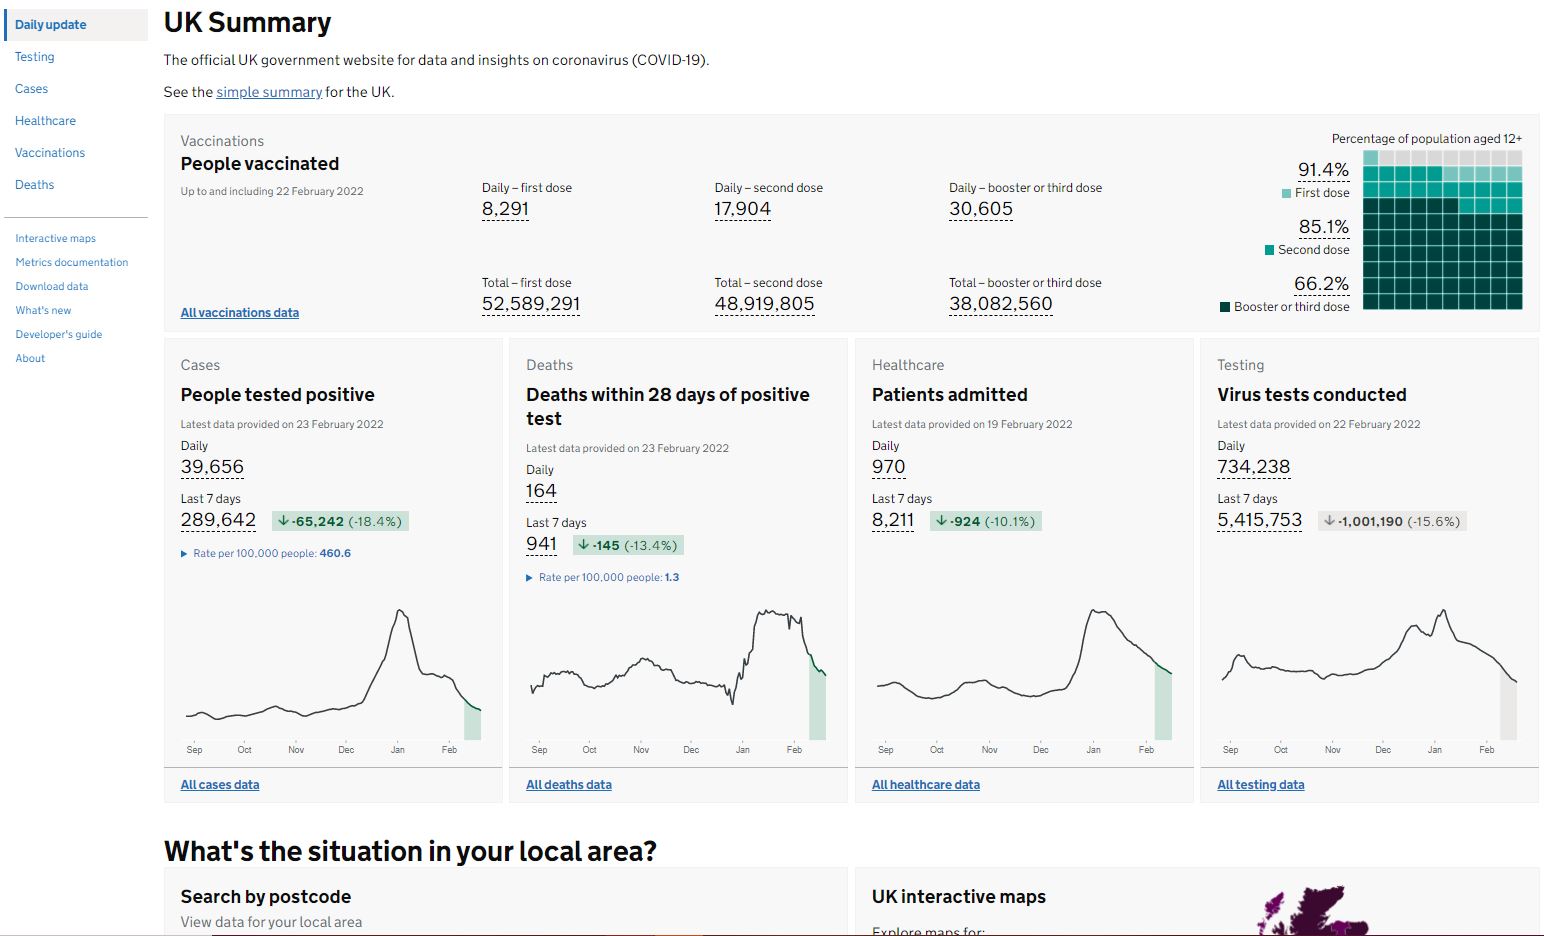
As the pandemic continues to evolve, user interests and needs also change. We constantly reassess our data and design to meet these shifting requirements. For example, in mid-2020 there was high interest in testing capacity, so test data was prominent on the dashboard. However, interest has now shifted and is more focused on the vaccination programme (in particular boosters since the emergence of the Omicron variant). To meet this changing need, we have made vaccinations more prominent, and expanded our data to include trends, maps and local data (via postcode search functionality). We are also in constant collaboration with devolved administrations to improve the extent of UK-wide data.

August 2020: Tests prominent, no postcode search for local data, figures for whole pandemic, no trends.

August 2020: Tests prominent, no postcode search for local data, figures for whole pandemic, no trends.

February 2022: Vaccinations prominent​, postcode search for local data added​, tests moved down the page​, trends added: shown with figures, arrows and colour.

February 2022: Vaccinations prominent​, postcode search for local data added​, tests moved down the page​, trends added: shown with figures, arrows and colour.

Meeting different user needs

We present data in a variety of ways to suit different users and help aid understanding. This means the data are of value to people looking at it both for personal interest (around 89% of our audience) and for professional reasons.​

We provide:​

  • visualisations, including graphs, maps (choropleths), and arrows to indicate trends​
  • simple headline figures in web and PDF formats​
  • full data tables​
  • data downloads in 4 different formats (CSV, JSON, JSONL, and XML)​
  • multiple Application Programming Interfaces (APIs)​
  • supplementary downloads, such as population denominators

We provide data and metadata at the greatest level of detail possible for those who need it, and simpler overviews for users who need less detail, with explanations provided in plain English.​

Open, efficient and technologically advanced

We are open and transparent about dashboard developments and any issues that occur. You can find details on the latest updates, changes and data issues on the ‘What’s new’ pages. Some of the more recent additions to the dashboard are: ​

  • virus tests (all virus tests and lab-based virus tests) by specimen date added for England plus regions and local authorities
  • age breakdowns and local data added for booster or 3rd dose vaccinations
  • new metrics documentation page listing all current and historical metrics (searchable by name, category, type or availability by area type)

We strive to make our work ‘low burden, high benefit’. For example, we use existing datasets and add value to collections that have been stood up for COVID (for example, hospital data) by reusing the data and presenting it to the public. We use leading edge technology and data pipelining from numerous data sources.

Value means more than just the number of people viewing the dashboard. We know this data is of huge public interest, but we also want to make sure we are presenting it as clearly and accurately as possible. We use rigorous statistical and design processes to make sure we are giving people the information they need in a way they can easily interpret. We engage with the people who use the dashboard as much as possible, to make sure we are not making assumptions and that we’re addressing their changing concerns in this fast-moving landscape.

We want our Dashboard to be valued by all users. Applying the Code pillars allows us to feel confident that our work is easy to access, remains relevant, and supports understanding of important issues in relation to COVID-19. The trust we have built is evident in the volume of use and overall popularity. As the pandemic evolves our Dashboard will also change, but what will remain constant is our willingness to ensure our statistics meet the Code.

Voluntary Application: Department for Health and Social Care

Highly Commended for the Award for Statistical Excellence in Trustworthiness, Quality and Value 2021

“I am delighted that the Test and Trace publication team has been recognised in this way. We stood up the publication very rapidly at the start of the pandemic, ten days after the launch of the Test and Trace Operation and have worked hard to ensure it has changed as the operation has developed. Everyone who has worked on this publication since it started has worked hard to ensure we adhere as much as we can to the Code of Practice whilst recognising that this is management information about the constantly evolving NHS Test and Trace operation. This award recognises their efforts in helping to ensure that we are transparent about its performance.”

Lucy Vickers, Deputy Director – Statistics and Data Science and Head of Profession for Statistics


Who are the Department for Health and Social Care (DHSC)?

We are a ministerial department working for the UK Government. We support ministers in leading the nation’s health and social care to help people live more independent, healthier lives for longer. DHSC publish weekly statistics on NHS Test and Trace (England) across all four testing pillars. This provides a weekly update on the implementation and performance of the NHS Test and Trace in England. We launched our first publication in June 2020, just two weeks after the Test and Trace programme started. Since February 2021, our team has published additional data alongside the core metrics, focusing on rapid asymptomatic testing in England.

Applying the code

We have been committed to applying the Code of Practice since our first publication on June 11 2020. A statement of compliance with the code of practice was published on June 18 2020, showing that we found complying to the code to be paramount, especially during a time where testing data was heavily criticised.

We have also responded to a rapid review the Office for Statistics Regulation (OSR) undertook in July 2020 which set out several suggested improvements. Our team released a re-structured version of the publication in August to better meet user needs. Since then, we have continued to improve the publication based on user feedback.

We have applied the Code to many aspects of our work. For example, pilots involving the use of rapid testing started from November 2020 and ramped up from January 2021. In response to this, the increased public interest, and the need for transparency, our team developed a publication roadmap outlining how a new statistical publication could ensure information on the rapid asymptomatic testing programme was published in an orderly fashion. The team worked at pace to set this up and continue to expand it to provide information on the different rapid testing use cases.

Trustworthiness, Quality and Value

Our Test and Trace statistics enhance the public value of statistics. To do so, our statistics are transparent, consistent with other published figures, and timely. We also add new breakdowns to our statistics as they become available, which grants greater insight to users of our statistics.

We make sure any Data Quality issues are made available in the methodology section of our background information including any limitations and reasons for revisions we may have made. The statistics are published weekly regardless of the trend they show to inform public debate, decision making, and raise public trust in the programme. We believe in doing this we increase the transparency of our statistics and allow users to use our data effectively.

This transparent reporting has provided significant value for understanding the Test and Trace operation and to improve it. In November 2020, the operation introduced an improvement whereby a case could inform their household contacts of the need to self-isolate, improving the contact tracing journey for these individuals. This caused the percentage of contacts reached to increase from 60% to 90%. Our team highlighted this operational change clearly in the release and made use of a dashed line in the tables and graphs to show the break in the series.

The DHSC Test and Trace statistics are a single point of contact for information on the Test and Trace programme. For every data source used, our team ensure the figures align with other published figures and outline any differences between published figures for users. This provides a clear evidence base for users and allows them to accurately compare between our statistics and others.

We published our Test and Trace statistics even over the Christmas period, upholding our commitment to publish these statistics in a timely manner for users. We add new data iteratively to provide users with the additional information they require and to reflect the ever-changing operation of Test and Trace.

Voluntary Application: The Department for Business, Energy and Industrial Strategy (BEIS)

Winner of the Award for Statistical Excellence in Trustworthiness, Quality and Value 2021

“The Greenhouse Gas Inventory team at BEIS are delighted to receive this endorsement from the RSS and the OSR for our publication. Our users rely on the Conversion Factors for Company Reporting to accurately estimate their greenhouse gas emissions, and we are proud to demonstrate how we uphold the trustworthiness, quality and value principles so that the factors can be used with confidence. We are very grateful to our team at Ricardo Energy and Environment and the Waste and Resources Action Programme for their dedication to producing such high quality factors, and also to the RSS, OSR and Voluntary Application Community of Practice for the opportunity to share and encourage best practice.”

BEIS Greenhouse Gas Inventory team


Who are BEIS and what are the Conversion Factors?

The Department for Business, Energy and Industrial Strategy (BEIS) replaced the Department for Business, Innovation and Skills (BIS) and the Department of Energy and Climate Change (DECC) in July 2016. We employ around 3,000 staff who work in our offices in London, Aberdeen and around the UK. We are responsible for: business; industrial strategy; science, research and innovation; energy and clean growth; and tackling climate change.

The Greenhouse Gas Conversion Factors for Company Reporting, or conversion factors, are published annually by the Greenhouse Gas Inventory (GHGI) team in the Science and Innovation for Climate and Energy (SICE) directorate. This publication allows users to convert activity data into greenhouse gas emissions. The resource is used by organisations to estimate their own greenhouse gas emissions from activity data, and therefore comply with Streamlined Energy and Carbon Reporting (SECR) regulations and other environmental reporting needs or requirements.

As well as being the main tool to support companies to report emissions in the UK, the factors are also used in policy development and statistical publications across UK government departments and are internationally regarded as a high-quality resource.

Applying the Code

While Trustworthiness, Quality and Value (TQV) have been core commitments in the production of the Conversion Factors since they were first published, in 2020 we released our first Statement of Voluntary Compliance to publicly demonstrate this. The Conversion Factors were therefore the first BEIS publication to voluntarily comply with the Code of Practice for Statistics.

Trustworthiness, Quality and Value

Given the increasing national and international focus on reaching net-zero emissions, a high quality resource for measuring emissions that can be used with confidence is of huge value, and in many cases essential, for a wide range of organisations and individuals. Trustworthiness is therefore a core principle for the Conversion Factors, and is exemplified throughout the production processes. They are produced by a team of analysts from Ricardo Energy and Environment and the Waste and Resources Action Programme (WRAP) with over a decade of experience and managed by BEIS’ GHGI team, all of whom are independent from the policy context, allowing the statistics to be presented objectively. The statistics are released annually in the first week of June, with users able to sign up for notifications of updates. The annual improvement programme, which is informed primarily by feedback from expert peer reviewers and users, is approved through two annual steering groups, providing a mechanism to ensure independent and transparent decision making delivering both high quality data and high value to users.

The Conversion Factors are produced to a consistently high quality. The primary data source for the Conversion Factors is the National Atmospheric Emissions Inventory (NAEI), which is annually updated and improved to use the best possible scientific methods and data sources and subject to scrutiny via annual expert reviews from the EU and the United Nations Framework Convention on Climate Change.

To ensure sound and transparent methods are being used in the production of the factors, we commissioned a 2021 audit of the Conversion Factors model suite. This found all the models comfortably exceeded required standards under the scoring system used in the BEIS QA Guidance for Models. The Conversion Factors are designed to deliver value to users by being relevant, accessible and up to date. Our improvement programme is innovative and responds to users’ needs, with a key example in the latest publication being the addition of new energy factors to enable companies to report energy use as required under the new SECR regulations.

Clarity and insight is delivered through the provision of a comprehensive methodology paper and accompanying major changes report, which explains year-on-year changes to the factors. We provide on-demand support to users of the factors through our dedicated mailbox, and the value we provide is exemplified through the positive feedback we receive on the provision of the factors; from individuals conducting personal interest projects to national governments interested in creating their own equivalents.

Ultimately, due to commitment in applying TQV, the Conversion Factors are one of the most comprehensive, high quality and up-to-date set of emission factors not only in the UK, but globally. They therefore deliver significant public value by enabling organisations to quantify, and subsequently measure progress towards reducing greenhouse gas emissions.

Voluntary Application: Scottish Fiscal Commission

Winner of the Voluntary Application Award 2020

Silvia Palombi, SFC, with the award

I’m delighted to accept this award on behalf of the team at the Scottish Fiscal Commission. Our stakeholders and ultimately the public depend on the Commission to uphold the highest standards of statistical practice as a matter of course. We’re grateful to the Royal Statistical Society and the Office for Statistics Regulation for the opportunity to have our work endorsed in this way.”

Silvia Palombi, Senior Economic Analyst

Who are the Scottish Fiscal Commission?

We are Scotland’s independent fiscal institution (IFI). The Commission was created to serve the needs of increased fiscal devolution in Scotland. We are a young organisation, established as a statutory body in 2017. Our official economic and fiscal forecasts are used by the Scottish Government to formulate the Budget, the Scottish Parliament to scrutinise the Budget, and stakeholders and the media to inform public debate. We are not considered an Official Statistics producer, but we have made an active choice to apply the Code of Practice for Statistics wherever possible.

Applying the code

Since our creation, we have adhered to the Organisation for Economic Co-operation and Development (OECD) Principles for IFIs, so we were already following the majority of the Code principles. But in March 2018, we published a Statement setting out our ongoing commitment to voluntarily apply the Code. It is thanks to this ongoing commitment that, while being in operation for only three years, we have already developed a reputation – not just in Scotland but also at UK level and internationally – for providing independent and credible forecasts that enhance public confidence.

Trustworthiness, Quality and Value

We are transparent, open and honest about what we do, describing methods and judgements that underpin our models and any limitations and risks to our forecasts. We also took steps to demonstrate our independence by pre-announcing Forthcoming Publications up to a year ahead, so that users know when to expect our outputs, and this has encouraged trust in the value of our outputs. We also ensure that all data are released in a reusable format, and we publish our approach to corrections and revisions. Building this trust is essential to meet our users’ need for independent scrutiny of the Government’s budget and to inform debate. You can find out more about our approach in this blog.

We strive to have the best possible information and evidence available to us by regularly interacting with data providers and through our annual Statement of Data Needs (SDN) publication, where we outline our statistical requirements and highlight areas for improvement.

We also engage with users through a number of channels including Twitter, our website and newsletter, external events we hold throughout the year, and additional papers on issues of relevance to users such as policy costings.

Our success in developing a reputation for delivering independent and credible forecasts was recognised by the OECD in last year’s independent review. They stated “the SFC has become a voice of authority, and is credited with enriching the fiscal policy debate in Scotland” and “stakeholders across the board praise the clarity and accessibility of its reports”.

Voluntary Application: Ministry of Housing, Communities and Local Government

Winner of the Award for Statistical Excellence in Trustworthiness, Quality and Value 2020 (previously Voluntary Application Award)

“72 people died in the Grenfell Tower Tragedy. Since then we have been collecting data on the materials on the outside of tall residential buildings to understand and estimate the number of buildings with dangerous materials on them and help evidence the government response. We have endeavoured to present these statistics in a way that is objective and transparent and in line with the Code of Practice so that the public, media and politicians understand the size of the problem that government faces and the progress we are making in remediating these buildings.

Everyone who has worked on this publication since it started has worked hard to ensure we adhere as much as we can to the Code of Practice whilst recognising that this is management information to support operational activity in the remediation of high rise buildings. This award recognises their efforts in helping to ensure we never have another tragedy like Grenfell.”

Paul Vickers, Head of the Building Safety Data and Analysis

Who are Ministry of Housing, Communities and Local Government (MHCLG)?

Our job is to create great places to live and work, and to give more power to local people to shape what happens in their area. Our responsibilities include driving up housing supply, increasing home ownership, and devolving powers and budgets to boost local growth in England. We publish statistics relating to deprivation, housing and homelessness, local government finance, planning performance and land use.

Applying the Code

Our Building Safety Programme Monthly Data Release started in December 2017 – following the Grenfell Tower tragedy. It provides the public, stakeholders and Parliament with the latest data (management information) on identification, remediation and remediation funding of high-rise residential buildings with Aluminium Composite Material (ACM) cladding – reassuring the public on progress and holding HMG and building owners to account in make buildings safe.

While Trustworthiness, Quality and Value (TQV) were core to our commitment to the Data Release from the start, we made a voluntary commitment to comply with the Code from April 2018.

As one of HMG’s early trailblazers on voluntary compliance, the Building Safety team have promoted the principles of TQV across the department, coaching others in voluntarily complying with the Code when full official statistics status is not possible.

Trustworthiness, Quality and Value

Following the Grenfell Tower tragedy there was considerable speculation about numbers of high-rise residential buildings with ACM cladding, and public and media concerns about certainty of estimates. Honesty and integrity are key principles to the monthly published Data Release which is managed by professional statisticians and overseen by the Department’s Statistics Head of Profession. As such, data governance is tightly controlled, with a clear published privacy notice explaining why data are collected, data sharing and the legal basis for processing data.

We have a transparent process for data collection, processing and publication. This process is clearly set out in the Release, and is labelled ‘Appendix 1’. From the outset, we have preannounced future publication dates; a marked change from the previous six months when statistics were released on an ad-hoc basis.

By producing a focussed Release, with pre-announced dates, we showed commitment to releasing regular statistics – demonstrating beyond doubt that we would publish statistics whatever they showed.

To ensure quality, our professional statisticians assess the suitability and quality of all data processes and sources used in the Release. Data originates from multiple sources. We have been working with providers from the outset to understand and improve data quality.

Two good examples are data on number of dwellings and data on remediation funding sources. These data were initially published with quality caveats, but work over the last six months with data providers has improved the quality considerably. This has communicated a message to these data providers about quality of building safety data.

Our approach to building safety data is used to drive forward progress on building remediation and to hold building owners, the construction sector, LAs and HMG to account. We have a long-term plan to increase data in the Release to build and communicate a clear evidence base.

Voluntary Application: University and Colleges Admissions Service

Highly Commended at the Voluntary Application Awards 2020

“As a charity, we are committed to publishing more data and insights to inform the public discussion on higher education and it’s very gratifying for the team to have our work recognised through this commendation.”

Sander Kristel, Chief Operating Officer

Who are the University and College Admissions Service? (UCAS)

We are the UK’s admissions service for all those seeking to enter Higher Education (HE). As an independent charity, we publish more than two and a half million data points a year including reports, bulletins and data that provide transparency about this process to a wide range of users and stakeholders. This free-to-use data helps to promote understanding of patterns in demand for HE and admissions to Universities.

Applying the code

Our decision to voluntarily comply with the Code of Practice for Statistics (which will now be referred to as the Code) since September 2019, provides greater assurance to our users of the trustworthiness, quality and value of our statistics. We have used the opportunity to apply the Code to our work to innovate and improve the accessibility of our outputs.

While we have always provided timely and transparent reporting on the HE admissions cycle in the United Kingdom, the pillars of the Code provide a structured and verifiable means of demonstrating our commitment to improving our data. Over 2018 and 2019, we nominated a Head of Profession for Statistics and a working group to consult on the key changes necessary in order to voluntarily adopt the Code. The work we have done strengthens our reputation amongst key stakeholders and the public as producers of high quality, useful analytical outputs.

Trustworthiness, Quality and Value

In applying the Code to our work, we are able to commit to publishing our outputs well ahead of time which enhances user confidence in the timeliness and reliability of our statistics. We also provide advanced notice of the general themes of our publications; this allows our users to better prepare to carry out their own analysis of our data and obtain greater benefit from it in doing so.

We have been able to increase the transparency of our output by publishing more details of our analytical methods. We have also increased the publication of both insight and statistical reporting, to further improve our transparency. The integrity of our data is regularly checked by a dedicated information governance function.

We publish both open format data and analytical reports and our commitment to the Code provides organisational impetus to support innovations in the presentation of these outputs. In 2019 we introduced interactive dashboards to improve our accessibility for a wider audience. These combine data visualisations with tables, using carefully designed filter and navigation menus to facilitate easy browsing and exploration of these extensive data releases.

We are committed to publishing data as part of a wider benefit to the public in support of our charitable belief in supporting progression via education. To increase value to users of our data, we routinely communicate with customers through a series of user groups and forums. We also regularly collaborating with other HE bodies to increase efficiency and consistency of methods.

We continue to aspire to further our commitment to the Code by publishing more details on our analytical methods and continuing to innovate in the visualisation and accessibility of our data.